# Use Cases
Our GeniiData flow product is a powerful tool for traders and investors looking to stay up-to-date with market trends and identify potential trading opportunities. By setting up filters, monitoring volume changes, and analyzing market trends, you can identify potential trading opportunities and stay ahead of the competition.
### Best Time to Trade
As a day trader, it's important to trade with volume and most activity to avoid being fooled by algorithms in the cryptocurrency market. After conducting research, we have found that the US stock market open time tends to be the best time to trade with volume.Here's why:
1. Increased Volume: The US stock market typically opens at 9:30 AM Eastern Time (ET) on weekdays, which coincides with the start of the business day in the United States. During this time, there is often increased trading volume in the cryptocurrency market, as traders and investors react to news and events from the stock market.
2. Greater Liquidity: With increased trading volume comes greater liquidity, which can help prevent traders from being misled by algorithms. By trading during high volume windows, day traders can take advantage of greater liquidity and potentially profit from market movements.
3. Market Activity: The US stock market open time is often associated with increased market activity, which can provide more trading opportunities for day traders. By monitoring market activity and volume changes, day traders can make informed trading decisions and stay ahead of the competition.
4. Risk Management: Trading during high volume windows can also help day traders manage their risk, as greater liquidity can make it easier to enter and exit trades. This can help prevent traders from being trapped in a position by an algorithm or market manipulation.
### Day Trader Setup
For day traders set up on TradingView: Add the VWAP and 200MA indicators to your chart by clicking on the "Indicators" button and selecting the VWAP and 200MA indicators from the list.
**VWAP**
**200MA**
Click "Settings"
Change Inputs "Length" to "200"
Change "Style" Color to different color compared to "VWAP"
### Preparation For Watchlist
Utilize an overview channel to be more prepared for your watchlist.
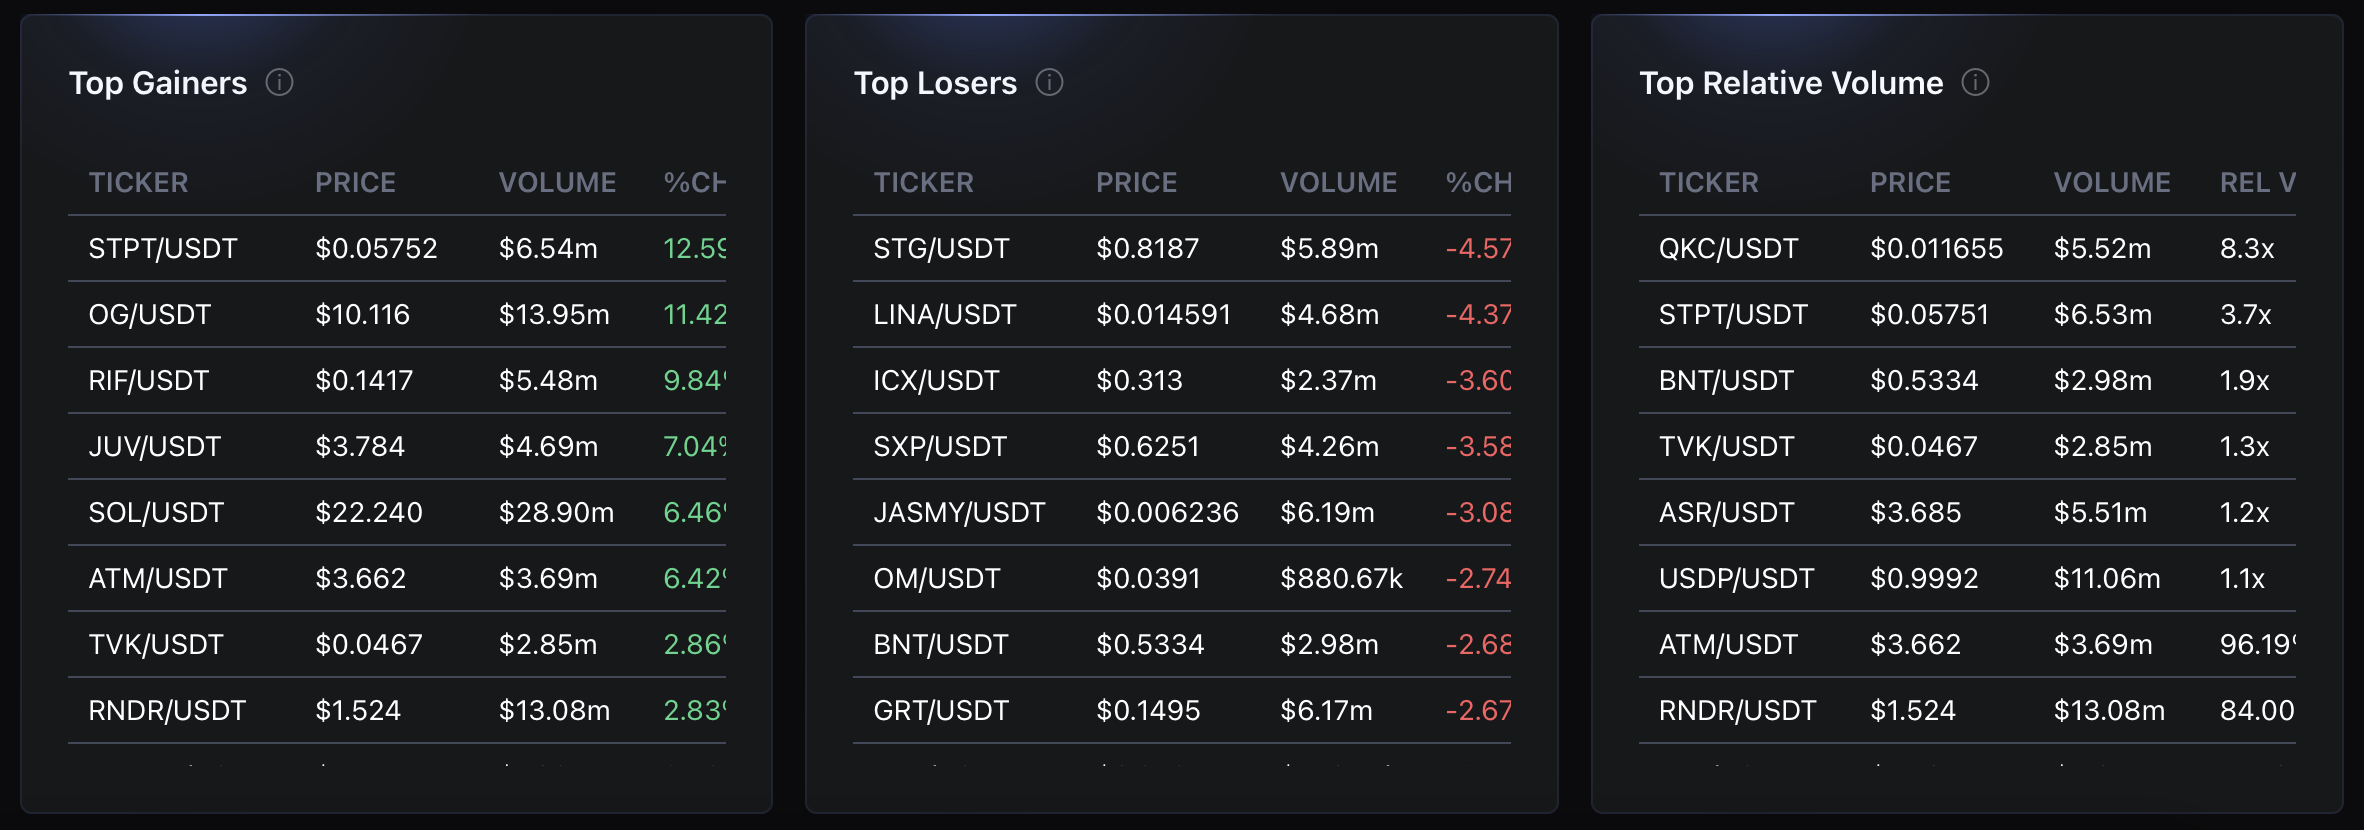
* Top Gainers , Losers and Relative Volume Pairs
Focus on the tickers listed in the top gainers, losers, and relative volume. These metrics act as filters to help you identify which ones deserve the most attention. This can be helpful for day traders and investors who want to identify potential trading opportunities and take advantage of increased liquidity in the market. Adding those tickers from overview channel to your watchlist and analyzing them before trading.
* Daily Market Tide
Daily Market Tide chart provides real-time data on BTC/ETH call and put options flow. By analyzing the option flow chart, you can identify whether investors are bullish or bearish on crypto market.
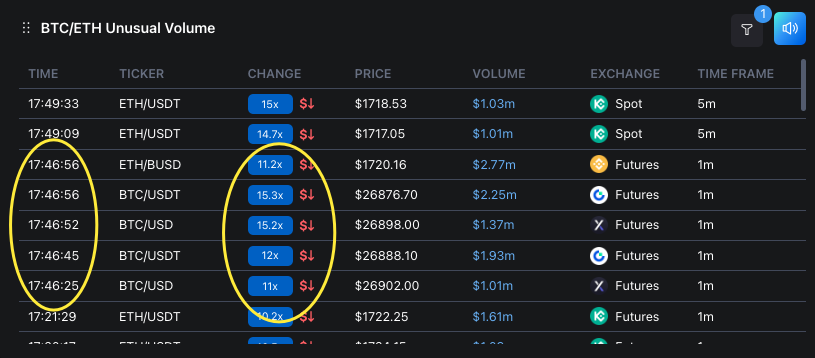
### **BTC/ETH Unusual Volume**
This shows the significant trading volume change of Bitcoin/ETH compared to its average trading volume over the past frames. If the current trading volume is significantly higher than the average volume, the chart will indicate an unusual volume trend. This can help traders identify potential trading opportunities in BTC or ETH.
Note: Our default % of change is set as 5X higher than the average volume.
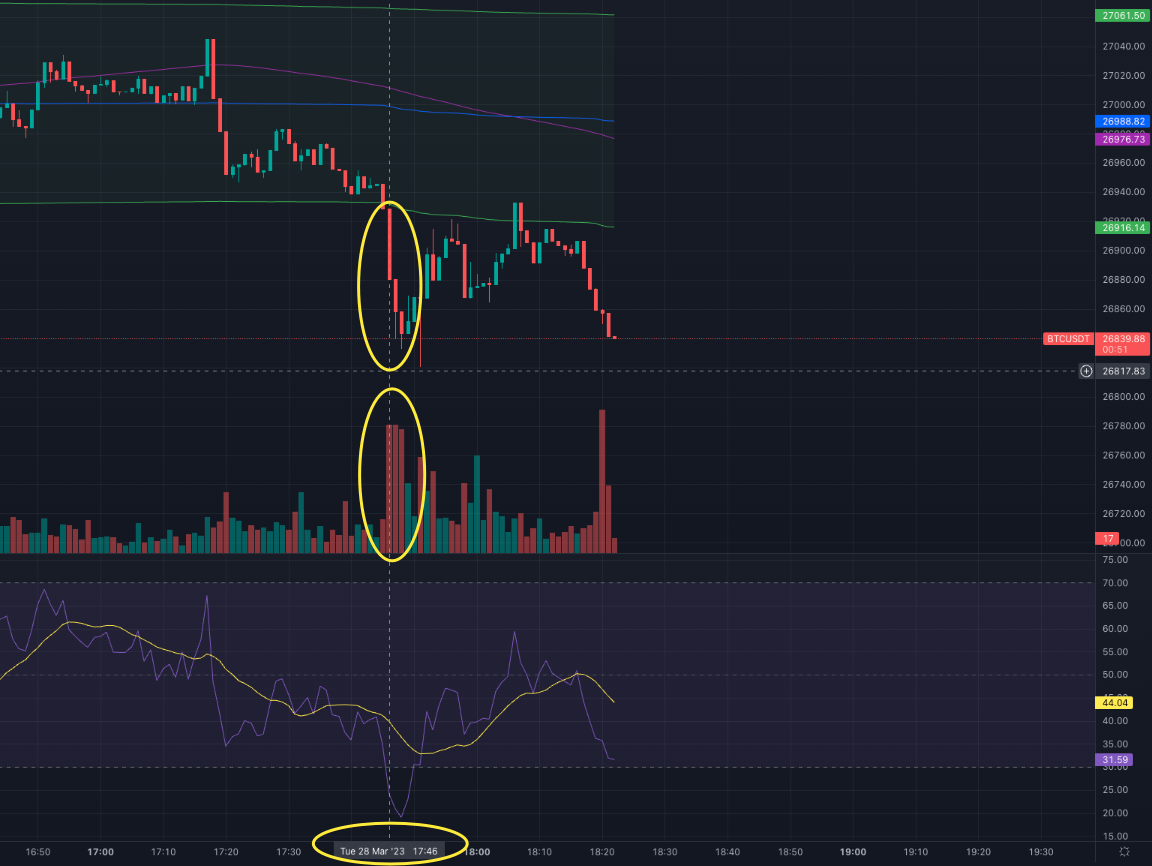
Our AI bot will voice alert traders all volume changes over 5X in real time. In this case, both BTC/ETH have downtrend price action across different exchanges such as Binance, DYDX, and Gateio during 17:46:25-17:46:56.
As you can see from the chart below, our alert caught the whole downtrend candle.
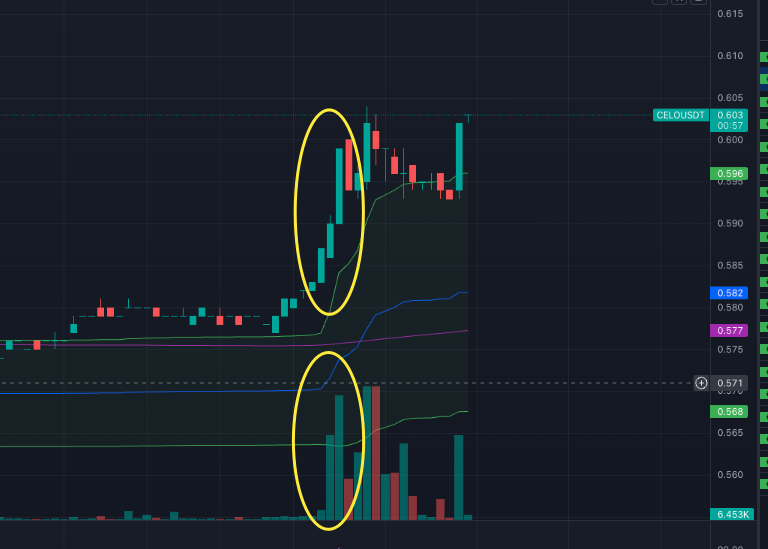
### **ALTS Unusual Volume**
The second chart is the Alts Unusual Volume Chart. This chart shows the trading volume of different altcoins compared to their average trading volume in different time frames. If the current trading volume of a specific altcoin is significantly higher than the average volume, the chart will indicate an unusual volume alert. This can help traders identify potential trading opportunities in the Alts coin market.
Our AI bot will voice alert traders all volume changes over 5X in real time. In this case shown below, both CELO/USDT have uptrend price action 19:54:43-19:59:17.
As you can see from the chart below, our alert caught the whole uptrend move candle.
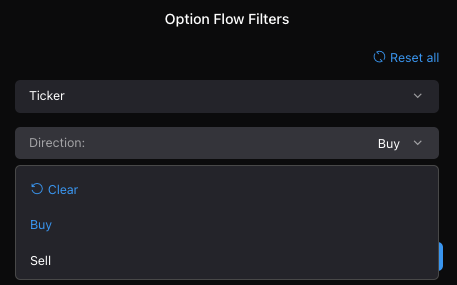
**FILTER**
Our filter is highly customizable and allows you to pick specific tickers, exchanges, trends, types, and time frames.
1. Specific Ticker: Our filter allows you to select a specific ticker, such APE, LDO, ARB. By selecting a specific ticker, you can focus your monitor on a particular cryptocurrency and gain a deeper understanding of its market trends.
2. Exchange: Our filter allows you to select from 8 different centralized and decentralized exchanges (CEX and DEX), including Binance, Gateio, Kucoin, Uniswap, and more. By selecting a specific exchange, you can analyze the trading activity and liquidity of a particular cryptocurrency on that exchange.
3. Trend: Our filter allows you to select an up or down trend for a specific cryptocurrency. By selecting a trend, you can analyze the sentiment and adjust your trading strategy accordingly.
4. Type: Our filter allows you to select between spot and futures trading. By selecting a type, you can analyze the trading activity and liquidity of a particular cryptocurrency on that market.
5. Time Frame: Our filter allows you to select a specific timeframe, such as 1min, 3mins, 5mins, 30mins, 1hr or 1 day. By selecting a time frame, you can analyze the market trends over a specific period of time and adjust your trading strategy accordingly. If you are focused on short-term trading, it is recommended to select 1-minute and 3-minute time frames on our highly customizable filter.
6. Volume: By selecting the volume filter option, you can identify trading pairs with different trading volumes. This can help you identify potential trading opportunities based on volume traded. For example, if a particular trading pair has a high trading volume, this may indicate increased interest in asset and potential trading opportunities.
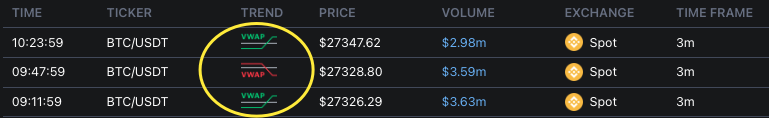
### **Crypto VWAP**
The Volume Weighted Average Price (VWAP) is a technical analysis tool that measures the average price of an asset over a given time period, weighted for volume.
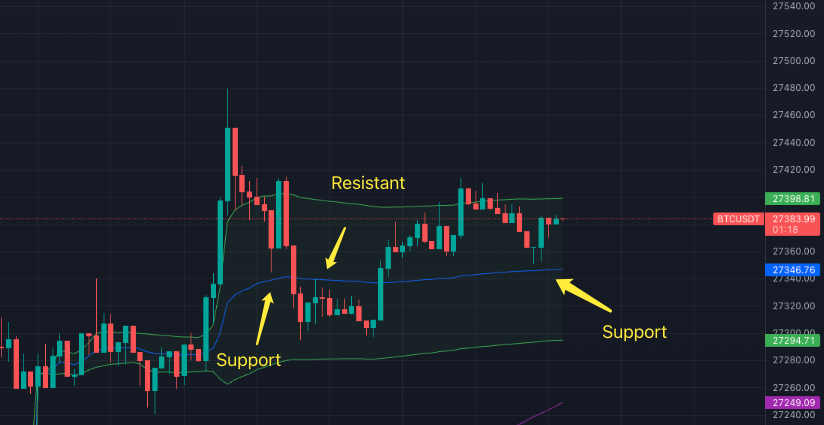
VWAP is a valuable tool for intraday analysis and can act as both resistance and support during the trading day. The AIBot alerts users in real-time when the price breaks above or below the VWAP line, which can help users make trading decisions. The best timeframes to use for VWAP are typically 1-minute, 3-minute, and 5-minute intervals.
When the price breaks above the VWAP line, it can be interpreted as a breakout from the resistance level, indicating that the asset is facing buying pressure and the price may rise. Conversely, when the price breaks below the VWAP line, it can be interpreted as a breakdown from the support level, indicating that the asset is facing selling pressure and the price may fall.
It's important to note that VWAP should be used in conjunction with other technical indicators and analysis tools to gain a comprehensive understanding of the market trends and trading activity. VWAP is a useful tool for intraday analysis, but it does not inherently have predictive qualities and is based on historical values. Traders should exercise caution and use their own judgment when making trading decisions based on VWAP signals.
Appendix: VWAP Calculation
To calculate the Volume Weighted Average Price (VWAP), there are typically five steps involved:
1. Calculate the typical price over a period of time: \[(High + Low + Close)/3]
* The typical price is the average of the asset's high, low, and close prices over a given time period.
2. Multiply the typical price by the volume for that time period: (Typical price x Volume)
* Multiply the typical price by the volume traded during the period to obtain the volume-weighted price.
3. Create a cumulative total of the typical price: Cumulative (Typical price x Volume)
* Add up the volume-weighted prices for each period to create a cumulative total.
4. Create a cumulative total of the volume: Cumulative (Volume)
* Add up the volume traded during each period to create a cumulative total.
5. Divide the cumulative total of the typical price by the cumulative total of the volume: VWAP = Cumulative (Typical price x Volume) / Cumulative (Volume)
* Divide the cumulative total of volume-weighted prices by the cumulative total of volume traded to obtain the VWAP.
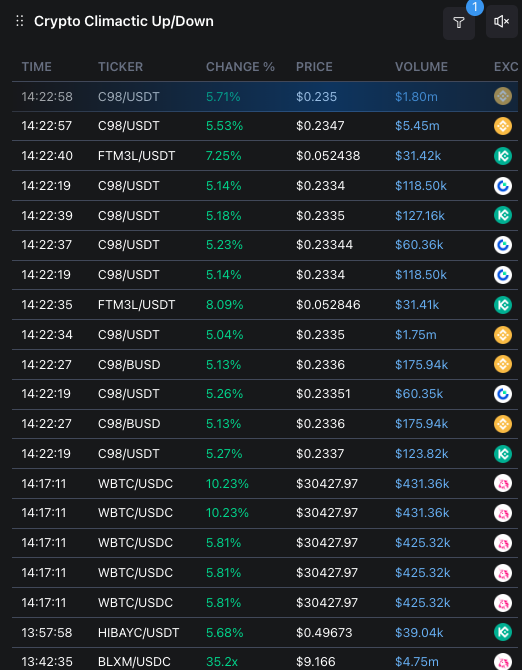
### Climactic Up/Down Move
"Climactic up/down Move" is a technical analysis term used to describe a sudden and rapid increase or decrease in the price of an asset over a short period of time.
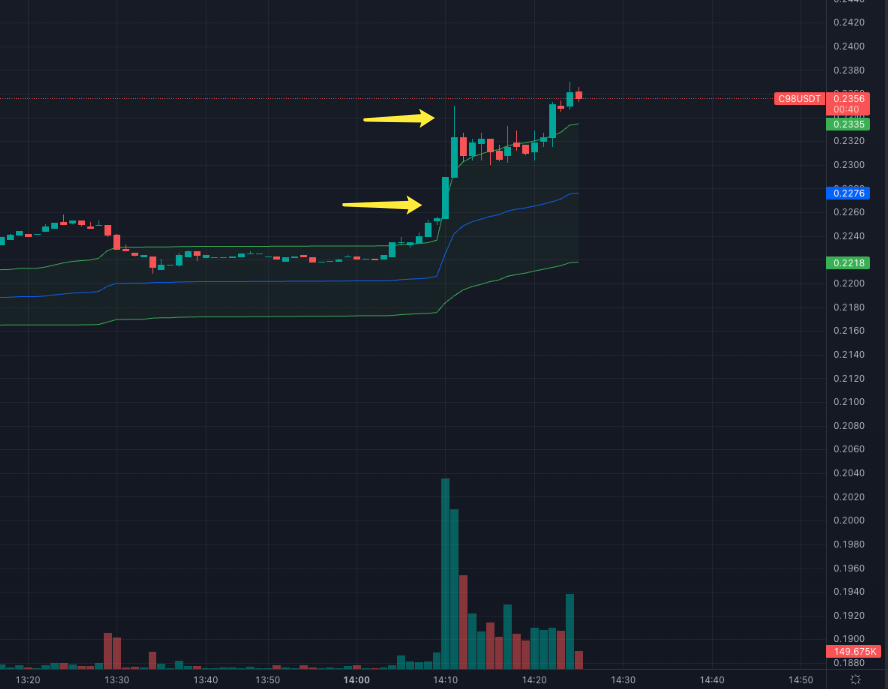
When an asset experiences a climactic up, it means that the price has spiked rapidly to the upside, often on high trading volume. This can indicate buying pressure and signal the start of an uptrend. However, a climactic up can also be a sign of an overbought market, where the asset has become too expensive and may be due for a correction or price pullback.
In contrast, when an asset experiences a climactic down, it means that the price has dropped rapidly to the downside, often on high trading volume. This can indicate selling pressure and signal the start of a downtrend. However, a climactic down can also be a sign of an oversold market, where the asset has become too cheap and may be due to a reversal or price bounce.
In this case, our AI Bot detected both volume and price change in secs. Day traders will be able to make trading decisions immediately based on alert.
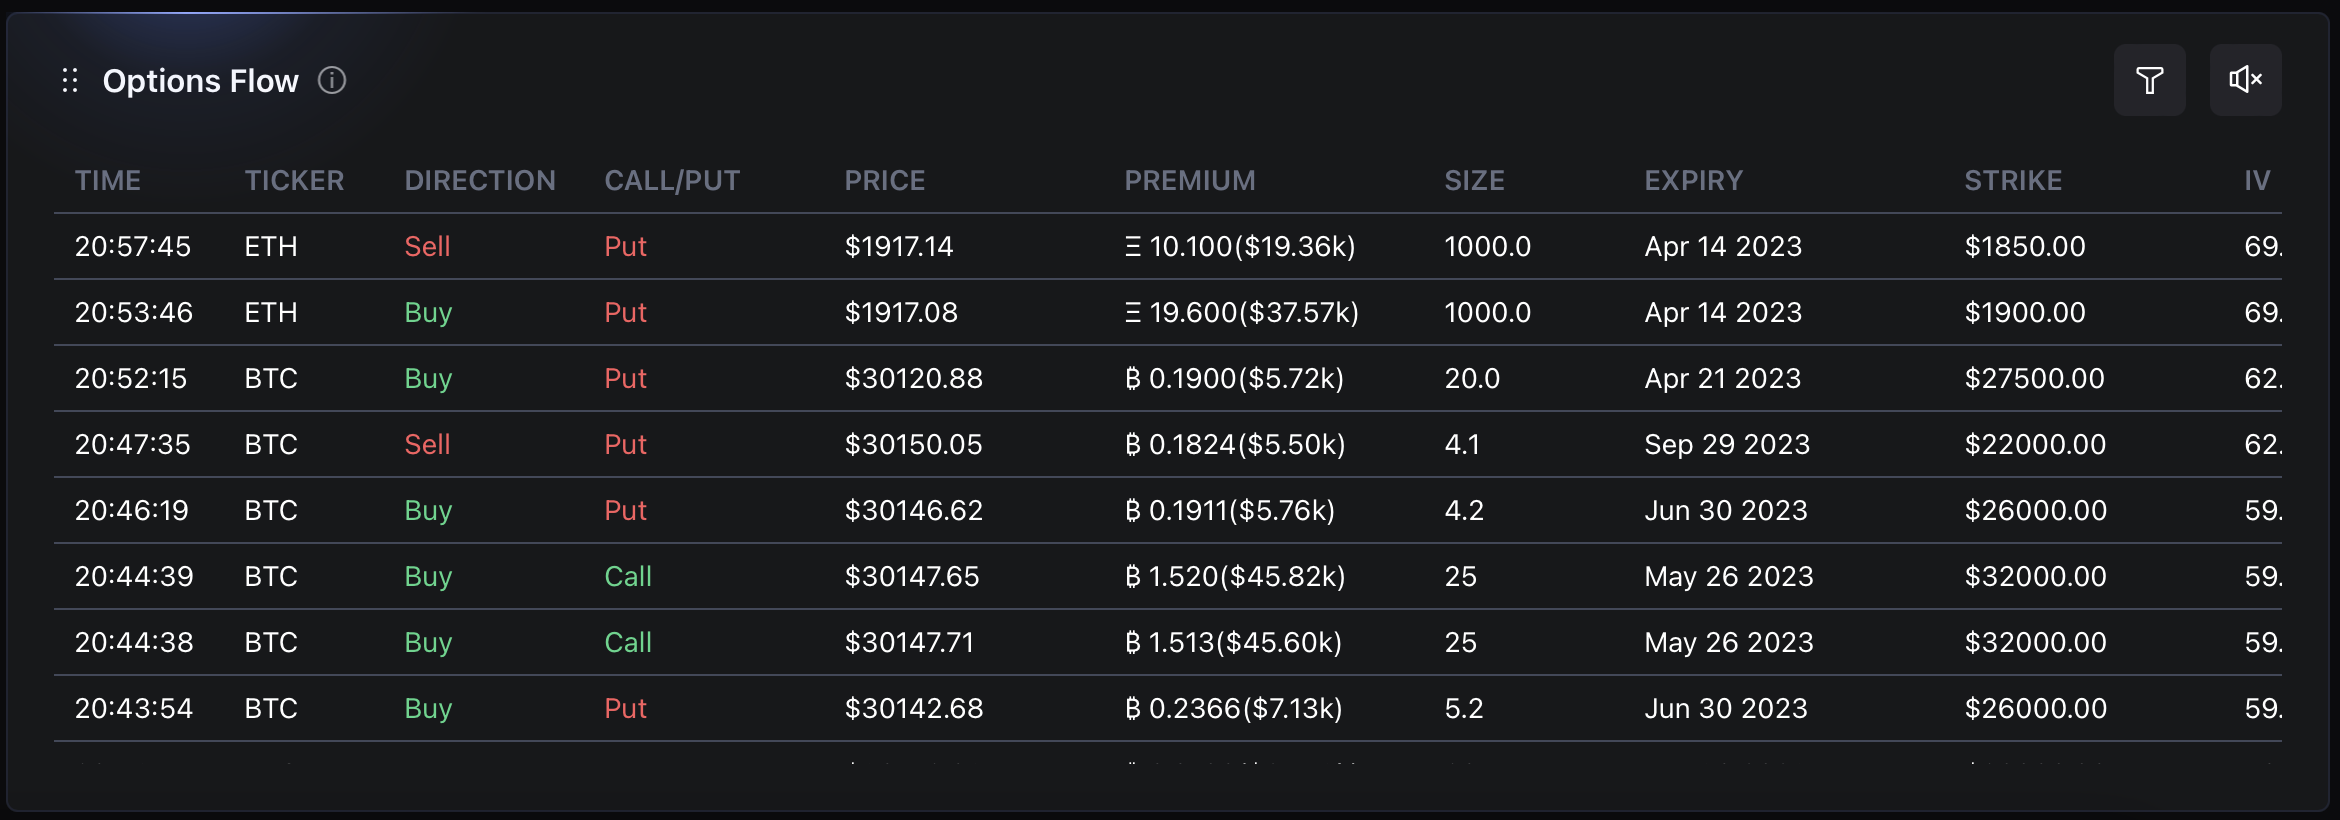
### Option Flow
This trading strategy involves monitoring the options market. For instance, where traders are buying call or put options with a premium value of over X dollars.
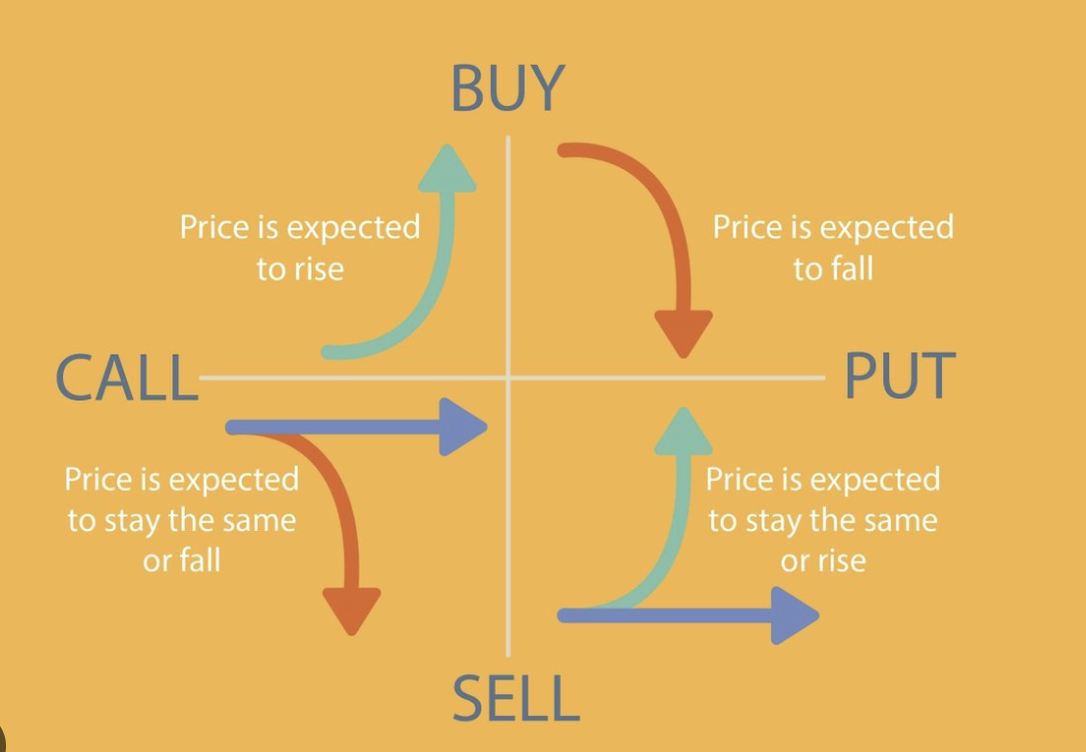
In options trading, the premium is the price paid by the buyer to the seller for the right to buy or sell the underlying asset at a specified price (strike price) within a specified time period. When traders buy call options, they bet that the price of the underlying asset will rise, while buying put options means they are betting that the price will fall.
There are four types of option orders:
By filtering the buy side of options orders and focusing on buy call and buy put orders, users can identify instances where traders are betting on the price of the underlying asset to rise or fall, respectively. This can be a useful tool for making directional trading decisions or identifying potential bullish or bearish (emoji in above chart) trends in the market.
When the premium paid for an options order is higher, it indicates that the buyer is willing to pay a higher price for the rights conveyed by the option. This can be a sign of confidence in the underlying asset, as the buyer may believe that the asset is likely to move in a favorable direction within the specified time period.
However, it is important to note that a higher premium does not guarantee profits, and options trading carries significant risks. Traders should be aware of the risks involved and use appropriate risk management strategies when trading options.
In this case, Option Flow Bot showing strong bullish buy call option orders indicate buyers are expecting BTC price going up.