# Live Flow
In both crypto and stock markets, volume-price relationship is highly reflective and relevant to the takes on trading strategies. The changes in trading volume and price are often closely related, as changes in trading volume can often affect the price movement, and vice versa. By analyzing the volume-price relationship, investors and traders can gain deeper market insights and predictions, which can help to formulate more effective investment strategies.
"Live Flow" scans the whole market up-to-second, captures signals of changes based on volume-price relationship. When you start to embrace the power of Flow, you will even find it hard to miss significant trading opportunities.
### **Crypto Unusual Volume(BTC\Ð & ALTS)**
The unusual volume identifies significant spikes in trading volume based on candlesticks across various cryptocurrencies and markets. When such an event occurs, the system sends out signals by highlighting on the screen and broadcasting audibly. The signals become even more intensive as volume accumulates, which provide users with actionable insights into potential market movements.
**①TIME**: The time displayed is based on the local time of the laptop/device.
**②TICKER**: The name of a currency pair. (ex. BTC/USDT, APE/USDT, etc)
**③CHANGE**: Volume change refers to the difference in the amount of current trading volume for a particular asset over a given period of time. We express volume as a percentage if it is less than 100%, and as 1X if it exceeds 100%.
**④PRICE:** The real-time USD price at the moment when abnormal trading volume is reported.
**⑤VOLUME**: Total volume of transactions in stable coins.
**⑥EXCHANGE**: Shows which exchange the abnormal trading volume occurs on. (ex. Binance, Kukoin, etc)
**⑦TIME FRAME**: The specific time duration for analysing the change
Note: Flow provides the following timeframes: 1m, 3m, 5m, 30m, 1h, 1day. We provide relatively short timeframes because we want to capture changes in trading volume over shorter time periods, which can help users quickly identify opportunities and execute trading strategies. Time frames can be adjusted to show different levels of detail or to analyze different trading strategies.
### **Crypto VWAP**
The Volume Weighted Average Price (VWAP) is a trading metric that calculates the average price of a stock or other security based on both the volume and price of trades. It is commonly used by traders to analyze the intraday price movement of an asset, and to identify potential buying or selling opportunities.
**①TREND**: Green icon represents the closed price has just crossed above VWAP, while the red icon represents the opposite.
**②PRICE** The price at the moment of crossing above or below the VWAP.
**③VOLUME**: The cumulative volume of the specific timeframe at the moment of crossing above or below the VWAP.
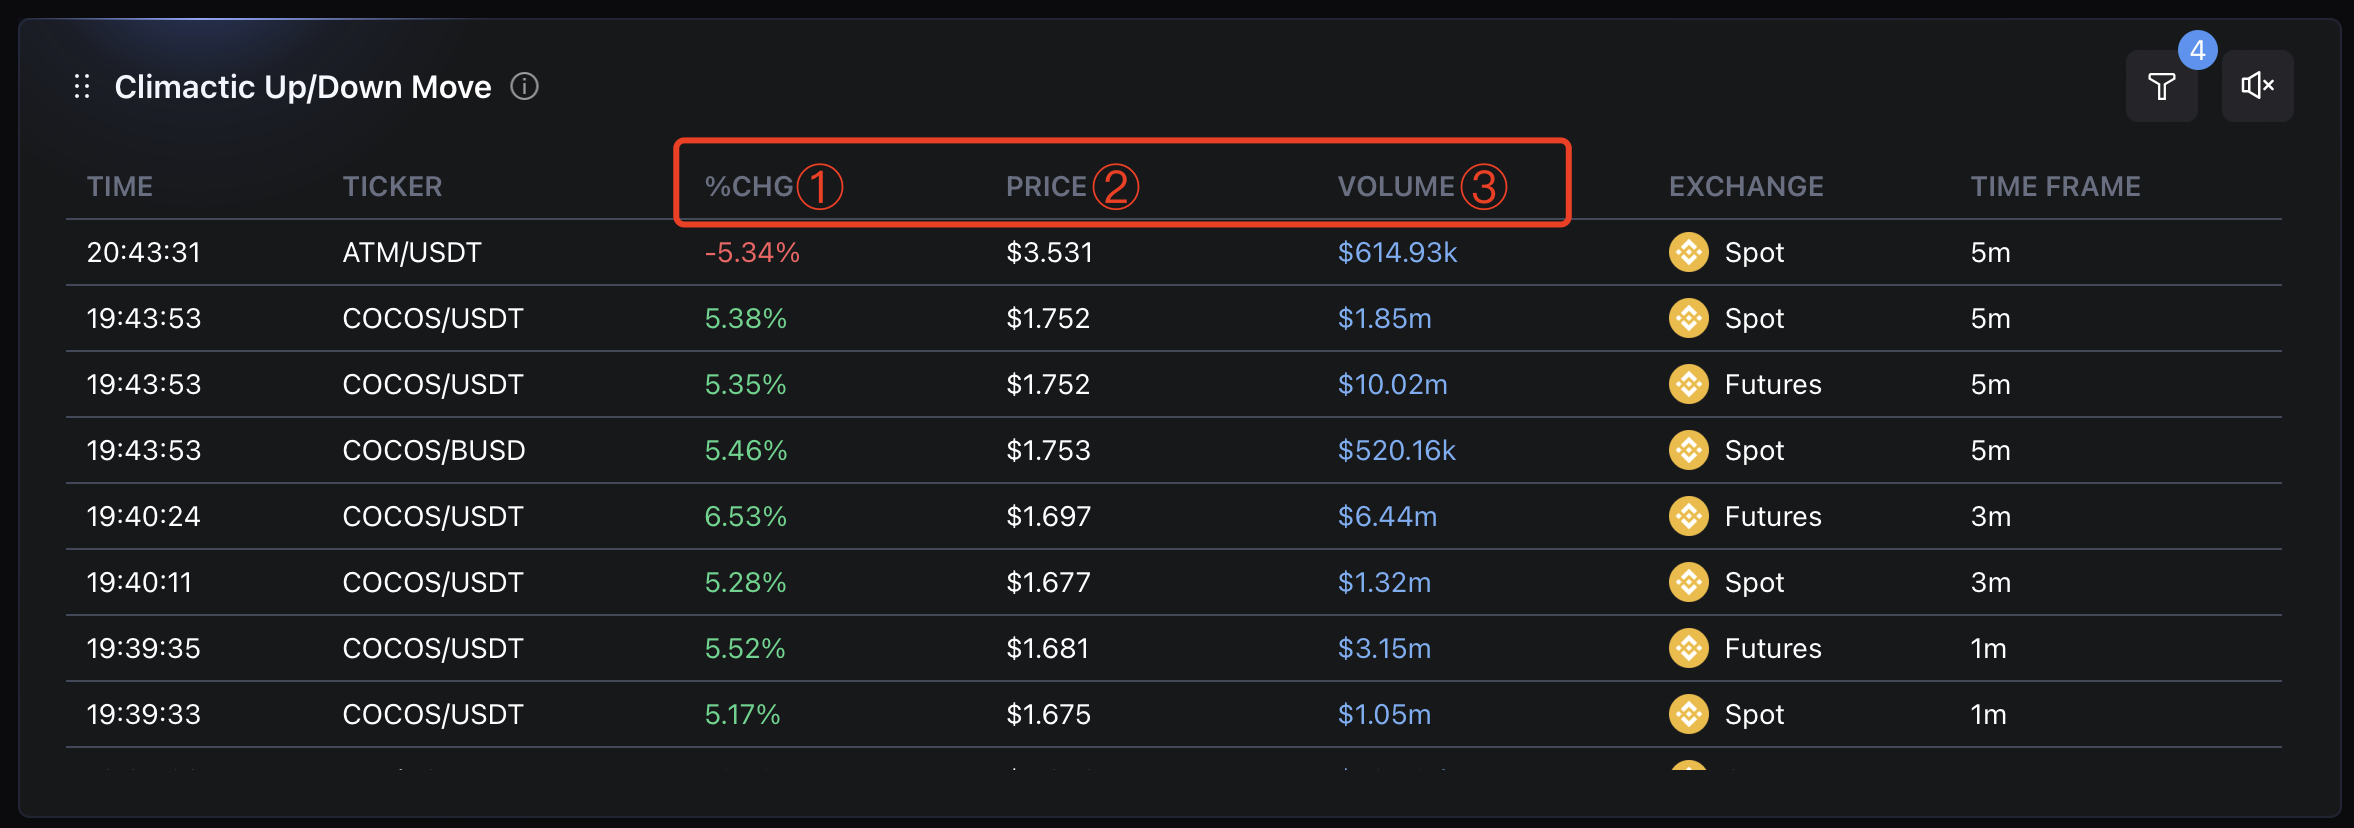
### **Crypto Climactic Up/Down Move**
Crypto Climactic Up/Down refers to a sudden and significant increase in buying or selling activity of a particular asset, which cause a large price swings. For instance, when a climactic down signal is generated, it suggests that there has been a significant increase in selling activity, which can indicate that the market is oversold and due for a rebound. This can present a buying opportunity for traders who are looking to enter the market at a lower price point.
**①%Change**: The percentage difference between the current price and the open price of an asset in the particular timeframe.
**②Price:** The price at the moment of generating the climactic signal.
**③Volume**: The cumulative volume of the specific timeframe at the moment of generating the climactic signal.
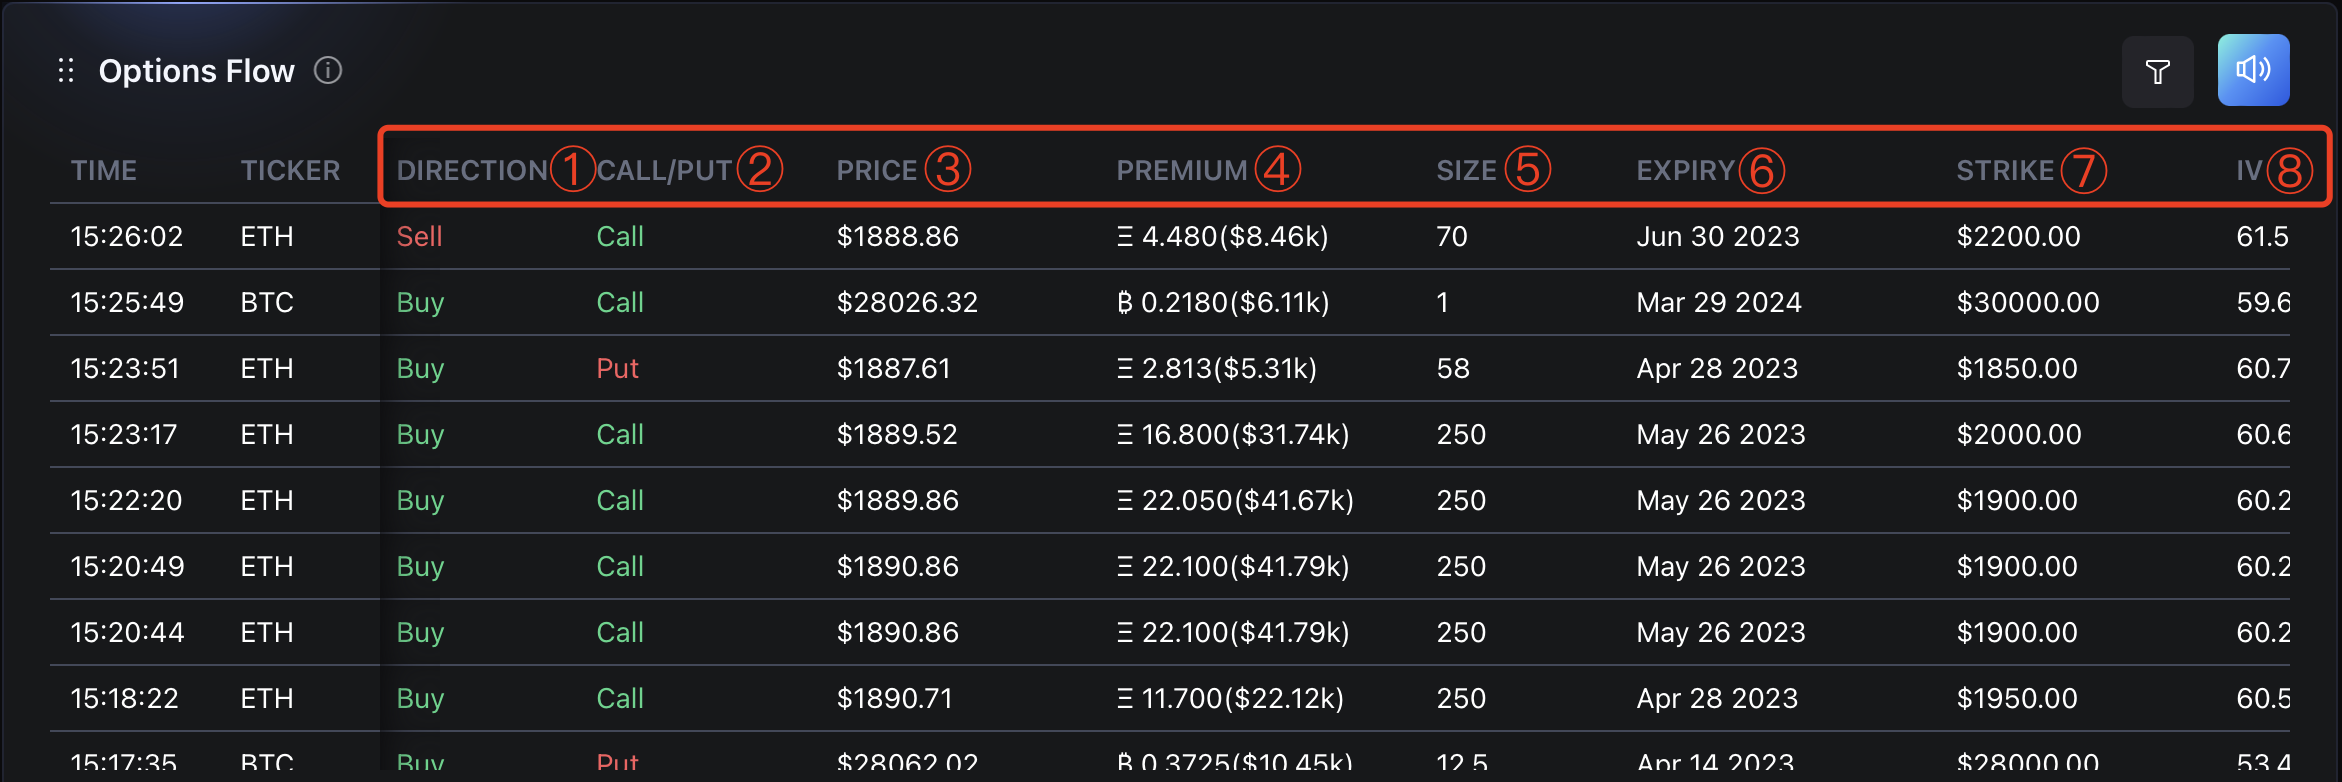
### **Option Flow**
Here, we monitor large option movements to predict the bullish or bearish sentiment in the market. Option flow analysis can help traders and investors identify potential trading opportunities, such as unusual or large orders, or identify market trends and patterns.
**①DIRECTION:** Refers to the buying or selling of the option.
**②CALL/PUT**: Refers to two types of option. A call option gives the holder the right to buy the underlying asset at a specified price, while a put option is just the opposite.
**③PRICE:** Assets' price at the time of option trading.
**④PREMIUM**: The price an options trader pays for the right to buy or sell an underlying asset.
**⑤SIZE**: The number of underlying assets that are covered by the option contract.
**⑥EXPIRY**: The expiration date of the option contract.
**⑦STRIKE**: The price at which an underlying asset can be bought or sold when exercising an option contract.
**⑧IV**:IV refers to implied volatility. The volatility of the underlying asset(how quickly and severely it moves), as revealed by market prices.
**⑨SENTIMENT**: The action of buying a call option and selling a put option represents a bullish sentiment, and a green bull emoji is used to represent this sentiment. Conversely, the action of buying a put option and selling a call option represents a bearish sentiment, and a red bear emoji is used to represent this sentiment.